前不久,ECharts 团队与微信小程序团队合作公布了 ECharts 微信小程序支持 Canvas 2D 的更新。
使用 Canvas 2D 可以使微信小程序环境中的 Canvas 与 W3C 标准 Canvas 接口更为接近,因而可以解决之前接口实现不一致引起的 bug。并且,Canvas 2D 的同层渲染可以解决图表与其他原生组件覆盖层级的问题。
简单介绍下echarts:
商业级数据图表,它是一个纯JavaScript的图标库,兼容绝大部分的浏览器,底层依赖轻量级的canvas类库ZRender,提供直观,生动,可交互,可高度个性化定制的数据可视化图表。创新的拖拽重计算、数据视图、值域漫游等特性大大增强了用户体验,赋予了用户对数据进行挖掘、整合的能力。
正文:
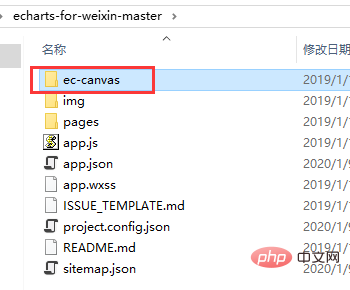
准备:小程序开发环境,下载ECharts组件,gitHub地址:https://github.com/ecomfe/echarts-for-weixin
操作过程:
1、把ec-canvas拷贝到项目中(可以不是根目录,但是后续引用的时候,注意更改文件地址)

2、对应页面json文件引入组件
{ "usingComponents": { "ec-canvas": "../../ec-canvas/ec-canvas" }}(免费视频教程:php视频教程)
3、对应页面js文件
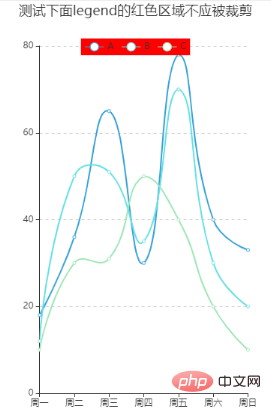
import * as echarts from '../../ec-canvas/echarts';function initChart(canvas, width, height) { const chart = echarts.init(canvas, null, { width: width, height: height }); canvas.setChart(chart); var option = { title: { text: '测试下面legend的红色区域不应被裁剪', left: 'center' }, color: ["#37A2DA", "#67E0E3", "#9FE6B8"], legend: { data: ['A', 'B', 'C'], top: 50, left: 'center', backgroundColor: 'red', z: 100 }, grid: { containLabel: true }, tooltip: { show: true, trigger: 'axis' }, xAxis: { type: 'category', boundaryGap: false, data: ['周一', '周二', '周三', '周四', '周五', '周六', '周日'], // show: false }, yAxis: { x: 'center', type: 'value', splitLine: { lineStyle: { type: 'dashed' } } // show: false }, series: [{ name: 'A', type: 'line', smooth: true, data: [18, 36, 65, 30, 78, 40, 33] }, { name: 'B', type: 'line', smooth: true, data: [12, 50, 51, 35, 70, 30, 20] }, { name: 'C', type: 'line', smooth: true, data: [10, 30, 31, 50, 40, 20, 10]}] }; chart.setOption(option); return chart;}Page({ data: { ec: { onInit: initChart } }, onReady() { }});4、wxml文件
<!--index.wxml--><view class="container"> <ec-canvas id="mychart-dom-line" canvas-id="mychart-line" ec="{{ ec }}"> </ec-canvas> </view>5、页面样式
/**app.wxss**/.container { position: absolute; top: 0; bottom: 0; left: 0; right: 0; display: flex; flex-direction: column; align-items: center; justify-content: space-between; box-sizing: border-box;}6、效果图

相关推荐:小程序开发教程
以上就是微信小程序中如何引入echart图表的知识。速戳>>知识兔学习精品课!
